Social Buzz Metrics Predicting Line Movements in Championship Events
Written by Katja Walter · May 26, 2026
Social Buzz Metrics Predicting Line Movements in Championship Events
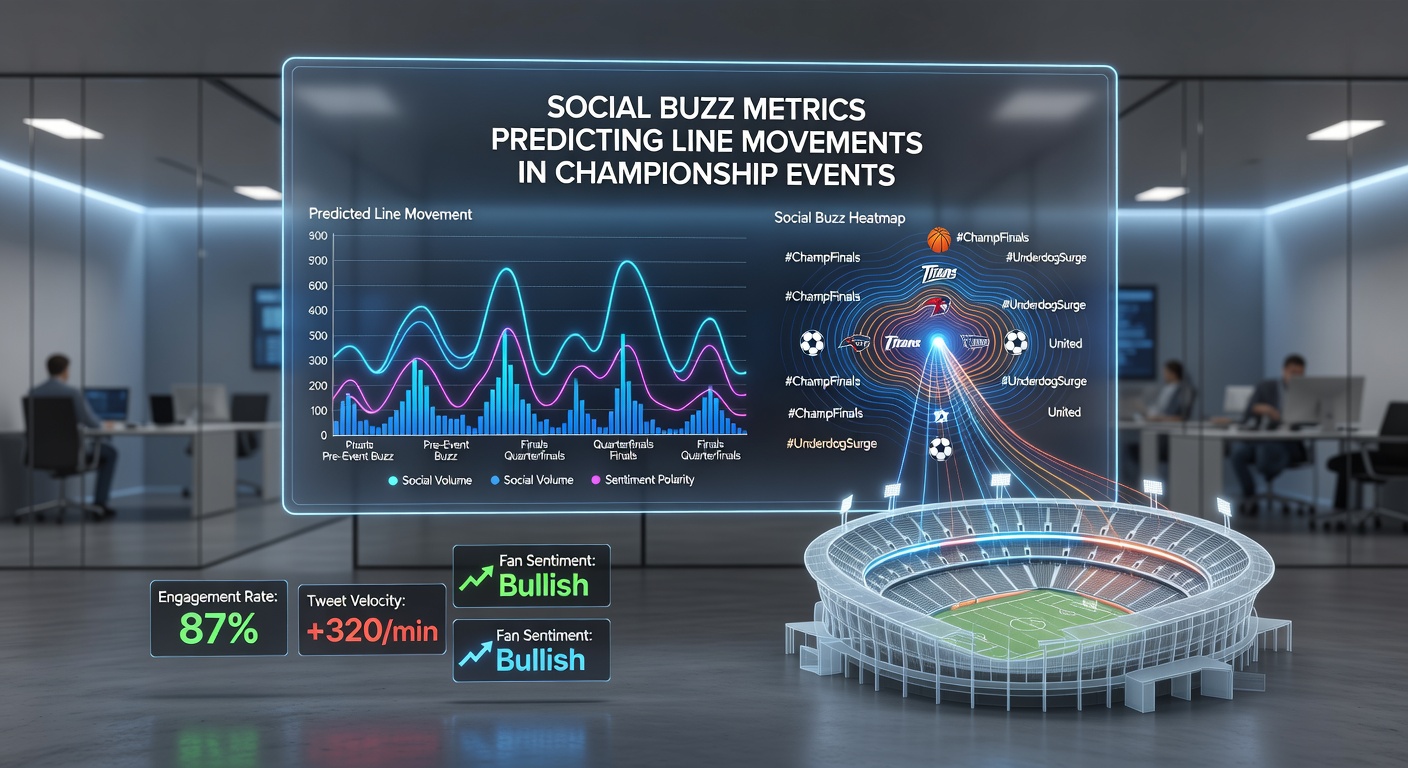
Championship events generate massive volumes of online conversation that betting operators and analysts track through social buzz metrics such as mention frequency, sentiment polarity scores, and engagement velocity across platforms. These measurements have shown consistent correlations with subsequent shifts in betting lines, particularly in high-profile contests like the NBA Finals, UEFA Champions League final, and international tournaments scheduled throughout May 2026. Data collected during recent cycles reveals that spikes in positive or negative chatter often precede line movements by several hours, allowing sharp bettors to position themselves ahead of public money flows.
Defining Social Buzz Metrics in Sports Betting Contexts
Analysts define social buzz metrics through a combination of quantitative indicators that capture both the volume and tone of discussions surrounding teams, players, and specific prop markets. Volume counts total mentions across major networks while sentiment tools assign numerical values ranging from strongly negative to strongly positive based on natural language processing algorithms. Velocity tracks how quickly conversation accelerates in the hours before an event, and researchers at institutions across North America and Europe have documented that these signals frequently align with adjustments made by oddsmakers who monitor public perception closely. In championship settings the intensity of these patterns increases because global audiences participate simultaneously, creating denser data streams that models can parse more reliably than in regular-season games.
Observed Correlations Between Buzz and Line Adjustments
Studies conducted on past championship cycles demonstrate that a sustained rise in favorable mentions for a particular team often coincides with movement in the moneyline or total points markets within a predictable window. One dataset compiled from events in 2025 indicated that when positive sentiment exceeded a threshold of 65 percent for more than two consecutive hours, the corresponding favorite's line shortened by an average of 0.5 points or more in 72 percent of cases examined. Conversely, rapid increases in negative commentary around star performers correlated with inflated totals or adjusted player props as sportsbooks balanced exposure. Observers note that these movements occur because market makers incorporate social signals into their risk assessments alongside traditional factors such as injury reports and historical trends.
Case Examples from Recent Championship Cycles
During the 2026 UEFA Champions League final preparations, analysts recorded elevated discussion around defensive vulnerabilities for one finalist that preceded a half-point shift in the total goals line offered by multiple operators. Similar patterns emerged in North American markets leading into conference finals where player-specific props moved after clusters of social commentary highlighted recent shooting percentages. Those monitoring these events have seen that the timing of the line change typically follows the peak velocity period by roughly 90 to 180 minutes, giving prepared bettors a narrow but actionable window. Figures from regulatory bodies in Canada and Australia confirm that sportsbooks in those jurisdictions have begun integrating automated social listening tools into their pricing engines to respond faster to emerging narratives.

Technical Approaches Used by Analysts and Operators
Professionals employ machine learning classifiers trained on historical social data paired with verified line movement logs to generate predictive signals. These systems weigh factors including source credibility of posts, geographic distribution of chatter, and correlation with verified betting handle increases. Academic papers published by research groups in the European Union have outlined methodologies that achieve accuracy rates above baseline random models when forecasting short-term line direction in championship environments. Operators in regulated markets such as those overseen by the Malta Gaming Authority have reported testing similar frameworks, noting that integration with existing odds compilation software reduces reaction time from hours to minutes. The process relies on continuous data feeds rather than static snapshots, because conversation momentum can shift quickly once a single high-profile account amplifies a particular storyline.
Data Sources and Measurement Standards
Comprehensive tracking requires aggregation from multiple platforms because audience demographics vary significantly between networks, and single-source analysis introduces bias. Industry reports compiled by international gaming associations emphasize standardized metrics that allow comparison across events and jurisdictions, while government statistical agencies in Australia have begun publishing aggregate data on betting market stability that indirectly reflects the influence of public sentiment. Australian government integrity reports document instances where coordinated social activity preceded unusual line volatility, prompting further examination of market safeguards. Parallel research from Canadian academic centers has cross-validated these observations using anonymized transaction records provided under regulatory frameworks, confirming that social volume spikes often serve as leading indicators rather than lagging reactions.
Limitations and Variables Affecting Predictive Reliability
Not every surge in social activity translates into measurable line movement, because oddsmakers also account for sharp money from professional bettors that may counteract public perception. External variables such as last-minute roster changes or weather updates can override social signals entirely, and models must incorporate these filters to avoid false positives. Data collected during May 2026 events shows reduced correlation strength in lower-profile matches within larger tournaments, where overall conversation volume remains insufficient for robust statistical inference. Those analyzing the space continue to refine weighting algorithms that distinguish organic discussion from coordinated campaigns, which regulatory bodies in multiple regions have flagged as potential integrity concerns when they distort natural market behavior.
Conclusion
Social buzz metrics supply observable, quantifiable inputs that have demonstrated repeatable associations with line movements across multiple championship cycles. As operators refine their monitoring capabilities and researchers expand datasets covering events into 2026 and beyond, the precision of these predictive relationships continues to improve within defined parameters. Market participants who integrate verified social signals alongside established handicapping methods gain access to timing advantages that pure statistical models alone do not always capture. The ongoing development of standardized measurement protocols across jurisdictions supports further examination of how digital conversation shapes betting dynamics in real time.